Background
Drug overdose deaths have emerged as a significant public health crisis, posing a serious threat to society. As the issue escalates, it becomes increasingly vital to scrutinize how drugs are used and monitored. This data analysis seeks to address the following key questions:
1. Which age group has the fewest deaths from accidental drug use, and which has the most?
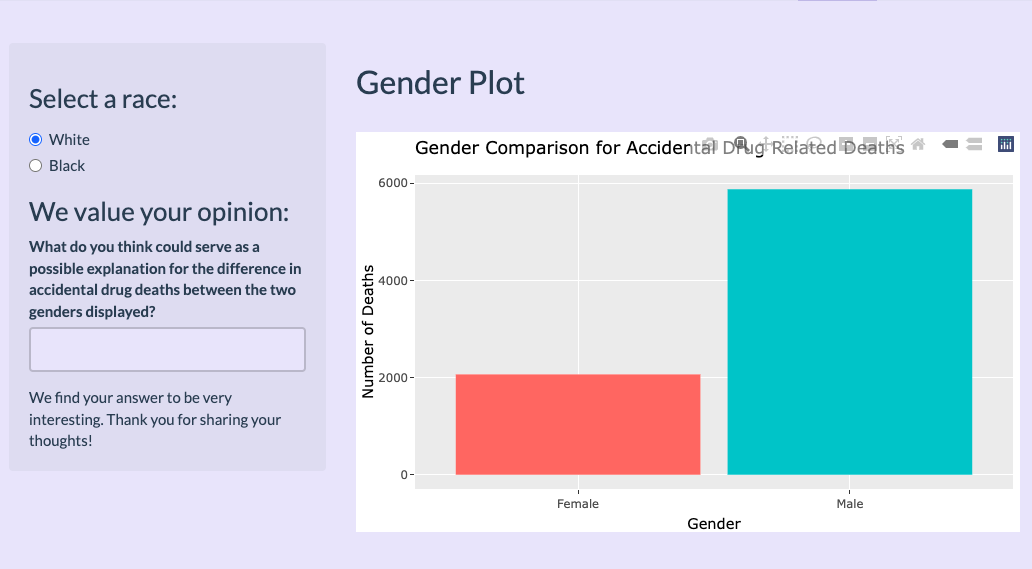
2. What are the total deaths by gender, and which gender has the highest and lowest death counts?
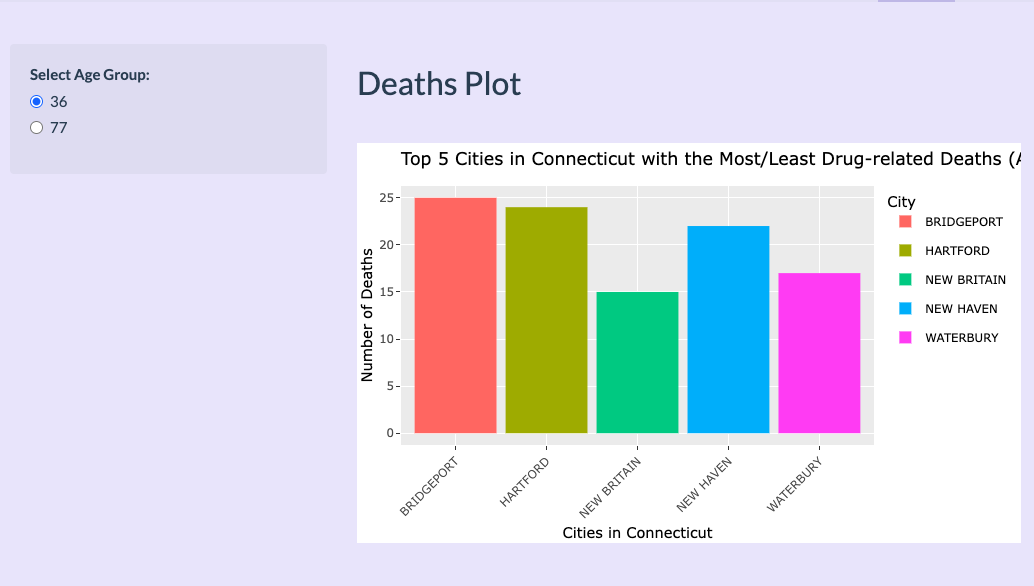
3. Which city has the most drug-related deaths, and which has the fewest?
Dataset
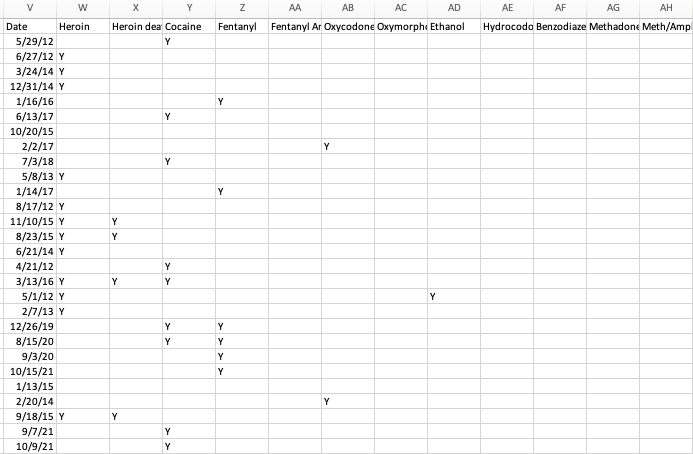
The dataset was sourced from data.gov, specifically the "Accidental Drug- Related Deaths" dataset. This data, compiled by the State of Connecticut Chief Medical Examiner and published by data.ct.gov, draws from multiple sources, including death certificates, lab results, and investigation reports. The dataset contains 9,202 observations and 48 features, providing a comprehensive overview of drug-related deaths in Connecticut from 2012 to 2018.
Plot Structures
Our analysis focused on the following categories:
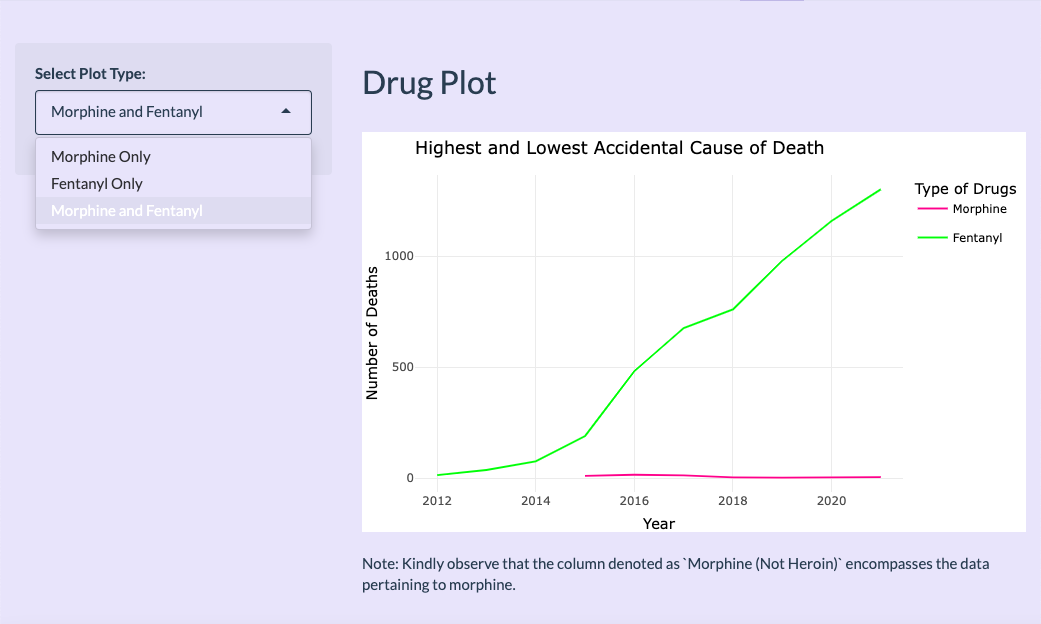
1. Drug causing the fewest (Morphine) and the most (Fentanyl) deaths.
2. Gender comparison for accidental drug-related deaths, revealing that male deaths were three times higher than female.
3. The top five cities in Connecticut with the most and least drug-related deaths: Bridgeport, Hartford, New Britain, New Haven, and Waterbury.
Challenges and Limitations
The data may only caputre a portion of the broader issue, making it difficult to fully analyze all aspects of the problem. In addition, challenges include underreporting or misreporting of factors involved in overdose deaths and limitations in the accuracy of testing methods. There may also be gaps in demographic information, such as missing data on race, ethnicity or socioeconomic status.
My Contribution:
- Leadership: Spearheaded the project as the team lead, from initial concept to final execution, ensuring all aspects were aligned with the overall goals.
- Data sourcing & Analysis: Identified and secured the dataset, then led a meticulous data cleaning process to ensure the accuracy and integrity of the information.
- Strategic Planning: Developed and implemented the analytical framework using R Studio, including data visualization and in-depth statistical analysis to extract meaningful insights.
- Plot Design & Visualization: Designed the plot structures to effectively communicate our findings, ensuring clarity and impact in the visual representation of the data. Primarily concentrated on the "drug plot" to address the third question.
- Collaboration & Coordination: Facilitated team collaboration, organizing regular meetings, and fostering an environment for problem-solving and innovation. Ensured the team met all deadlines and project milestones.
Accidental drug-use deaths in Connecticut (2012-2021)
Mar 2023 — Jun 2023